The International Agency for Research on Cancer (IARC), which is part of the World Health Organization (WHO), classifies particle pollutants as Group 1 carcinogens (cancerous to humans). To be under this same group means it is in the same level as certain infectious viruses, toxic chemical substances such as asbestos and benzene, and dangerous X and Gamma radiation.
Countries and regions in the world have different pollution exposure levels thru the years and for guidance purposes, the WHO came out with its 2005 air quality guidelines (published in 2006) on thresholds and limits on four pollutants (particulate matter included) that pose health risks.
Being much more smaller and therefore more dangerous as they can penetrate all the way to our bloodstream, the following daily averages of PM2.5 particle exposures over a one year period are used as numerical guides:
Annual Mean: 10 micrograms/m3
24 Hour Mean: 25 micrograms/m3
What the above figures mean is that an average of 10 ug/m3 or less of PM2.5 exposure per day over a 12 month period is considered acceptable. And it still is acceptable even if in some 24 hour period the figure goes up to a maximum of 25 ug/m3, provided that the average daily exposure over the same 12 month period is still at 10 ug/m3 or less.
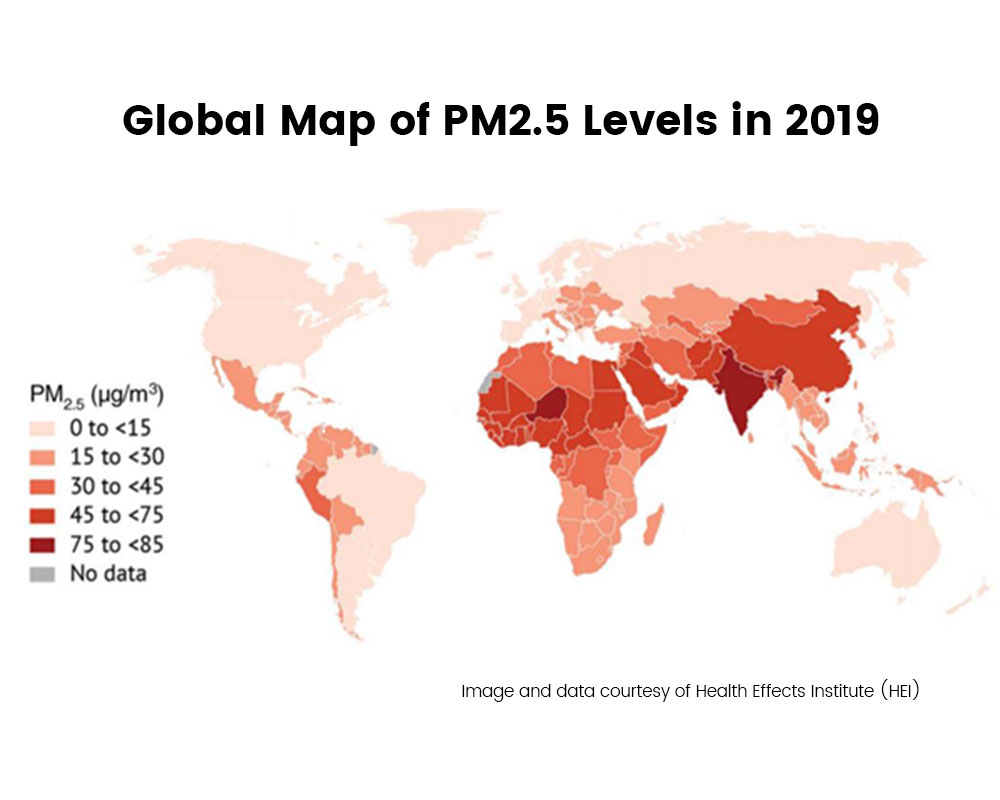
Covering the last decade, the Health Effects Institute (HEI) through its State of Global Air 2020 released report stated that over 90 percent of the world’s population experienced annual average PM2.5 concentrations that exceeded the WHO guideline of 10 ug/m3.
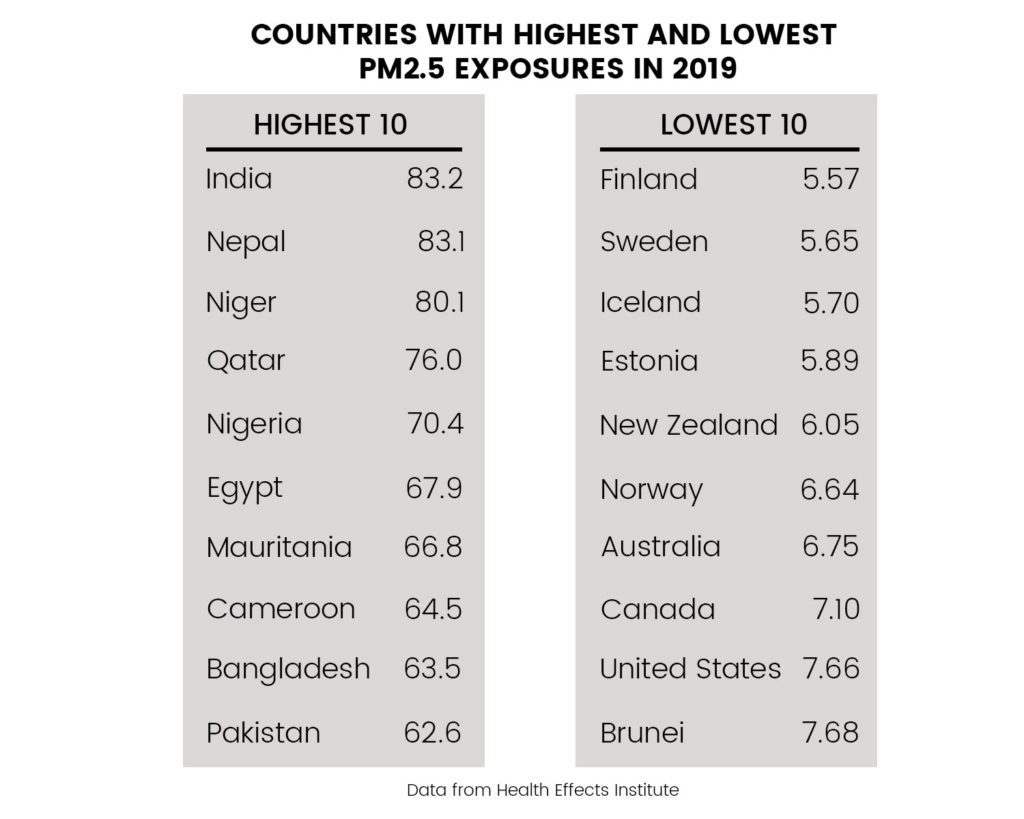
The following color coded map shows the 2019 PM2.5 exposure levels globally. The other diagram shows the top ten countries with the highest exposure, and the other top ten with the lowest exposures.
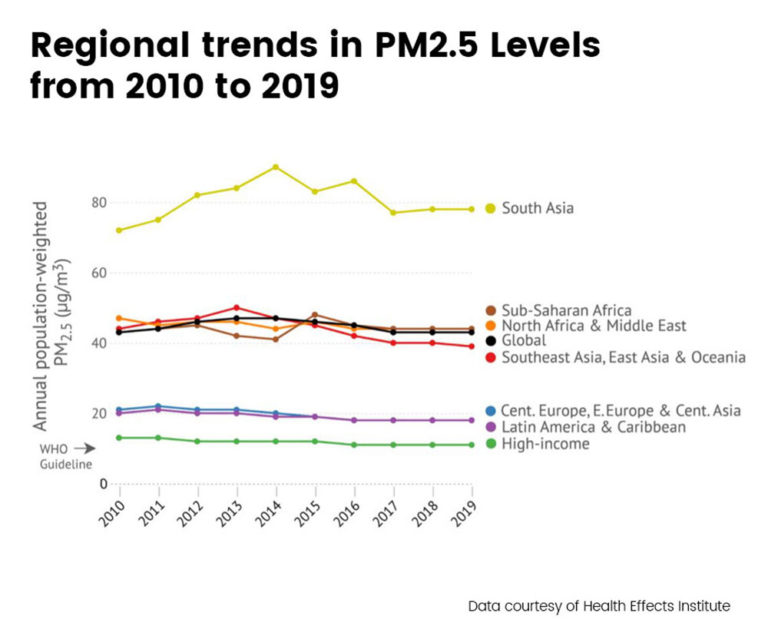
Global Trend. Worldwide exposure to PM2.5 slightly declined from 2010 to 2019 but different experiences were reflected across the regions. Some have seen improvements, notably in South East Asia, East Asia, and Oceania, while almost no improvement in the Middle East and Africa.
Wide disparities in PM2.5 levels between the regions have remained for almost a decade with South Asia showing the highest. Except for the countries from the high income region, all are above the WHO annual guideline of 10 ug/m3.
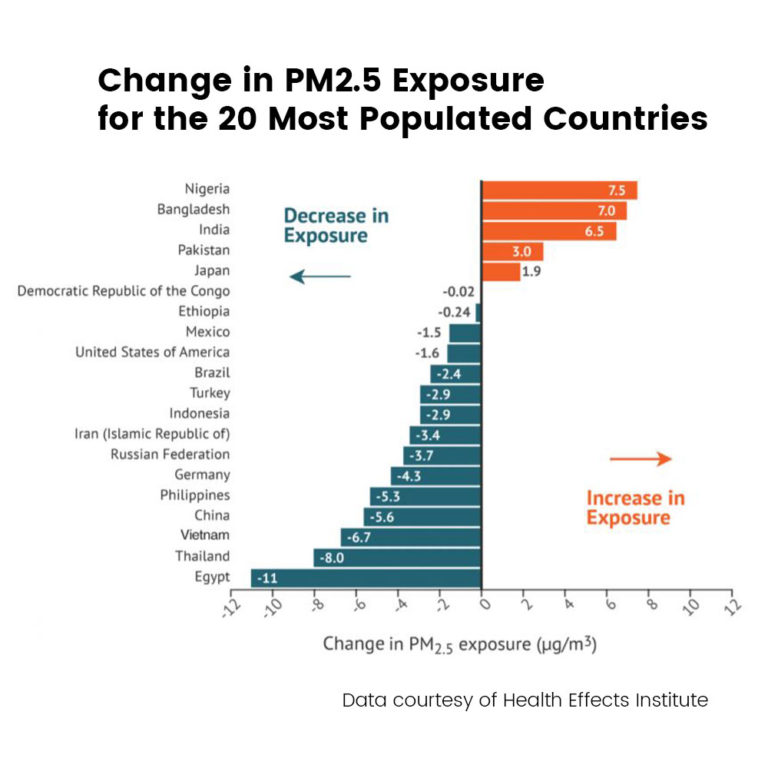
The good news is that out of the 20 most populated countries in the world (which makes up 70 percent of the global population), 14 have seen declines in their annual exposure over the past decade.
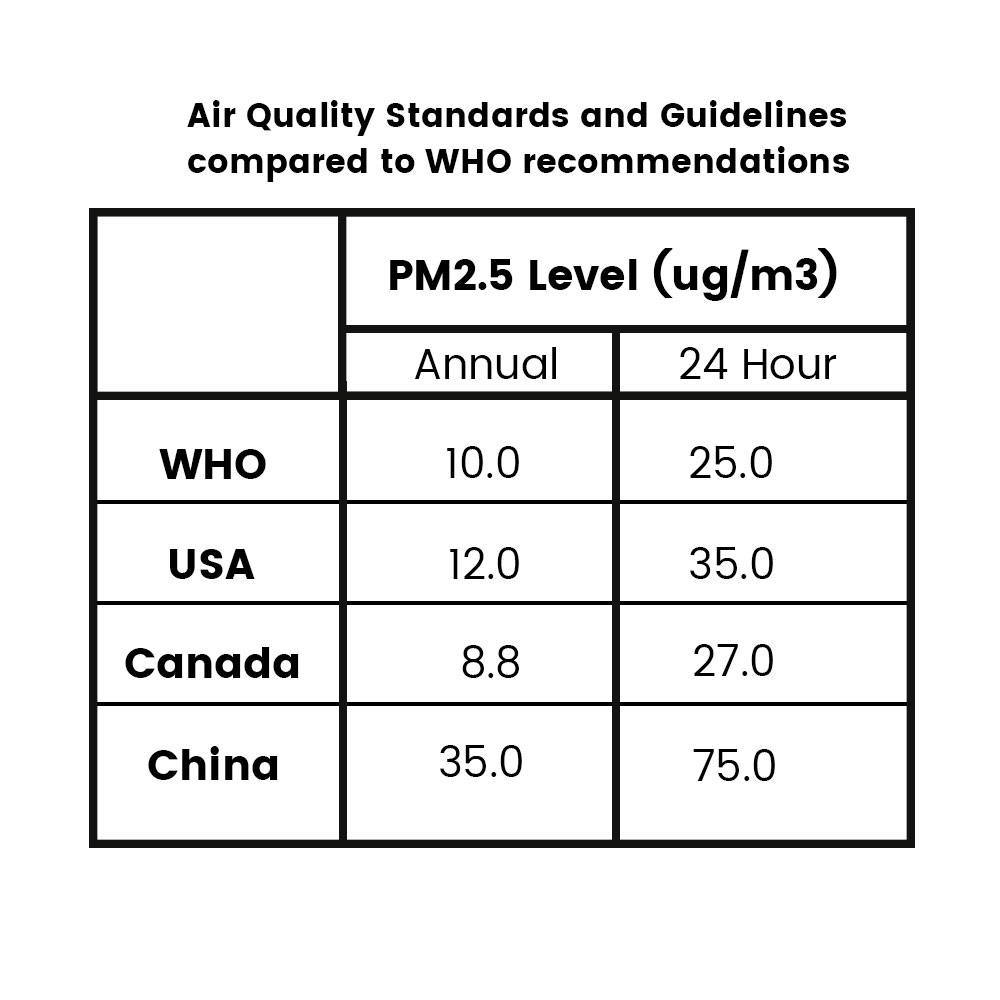
PM2.5 Guidelines in the USA, Canada, and China
The US Environmental Protection Agency (EPA) has set its daily target average at 12 ug/m3 over a three year period, slightly higher than the WHO guideline of 10 ug/m3. In Canada, the daily average is a more aggressive 8.8 ug/m3 or less over a five year period. In China, the set standard is 35 ug/m3 daily average for a year. The guide for China is much higher simply because of the comparatively much high levels they are still coming from.
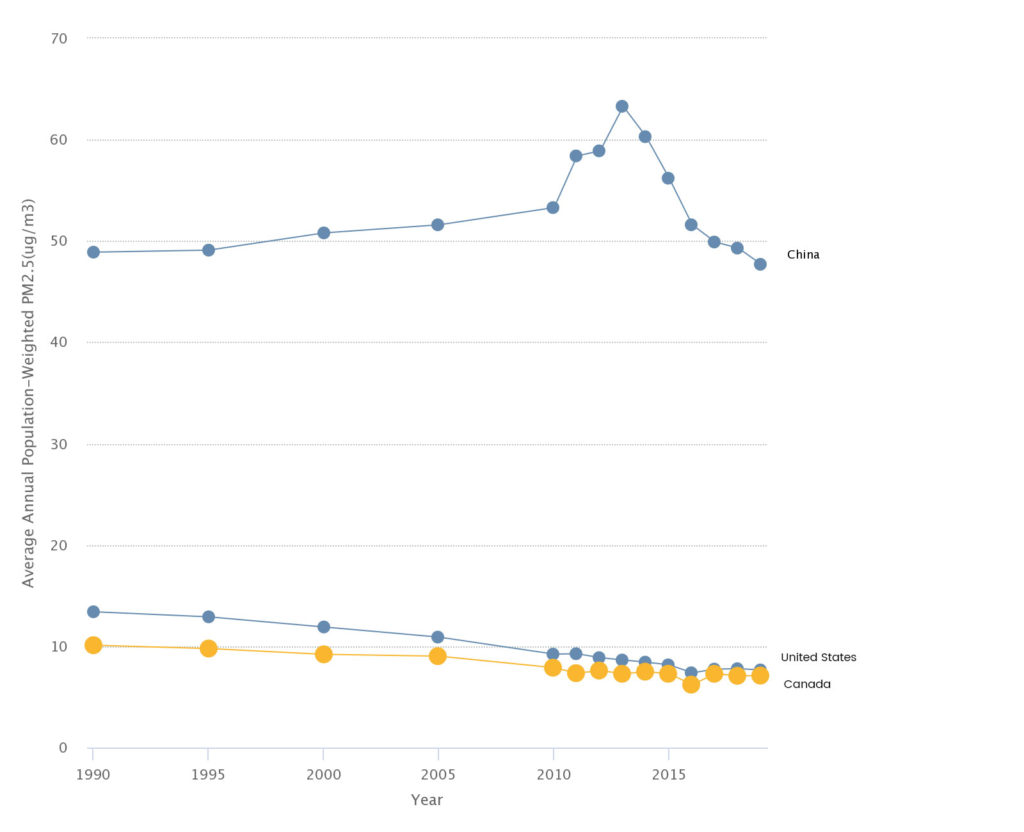
Trends in PM2.5 Levels in the USA, Canada, and China
Any level of air pollution, no matter how low, is harmful to human health
Harvard School of Public Health
Particle pollution safety targets are only guides.
A group of researchers from the Harvard School of Public Health reported in 2017 that short-term exposures to fine particulate air pollution, even at levels below current national safety standards, are linked to higher risk of premature death among the elderly in the U.S. It also stated that the mortality rate increases almost linearly as air pollution increases.
It has always been understood that exposure to fine particulate pollution results to deaths. But with the Harvard research results, there are now specific numbers. For each 10 ug/m3 daily increase in PM2.5 exposure, the mortality rate grew by 1.05% daily. This is in line with an earlier study from the same Harvard researchers stating that an increase of even just 1 ug/m3 in daily PM2.5 over the course of one year in the US would lead to 550 extra deaths per year.
It is noteworthy to highlight that all these deaths in the US occurred even during periods of low level PM2.5 exposures, even lower than that of the WHO.
We need to use therefore exposure level targets only as guides, especially for purposes of implementing pollution controls and policies. Any level of air pollution, no matter how low, will be harmful to human health.
REFERENCES
US Environmental Protection Agency (EPA)
The Harvard T.H. Chan School of Public Health
Health Effects Institute (HEI)
Impacts of Air Pollution in Canada 2021 Report, Health Canada
World Health Organization
aerione@aerione.com
77 City Centre Drive East Tower, Suite 501 Mississauga, ON L5B 1M5 CANADA